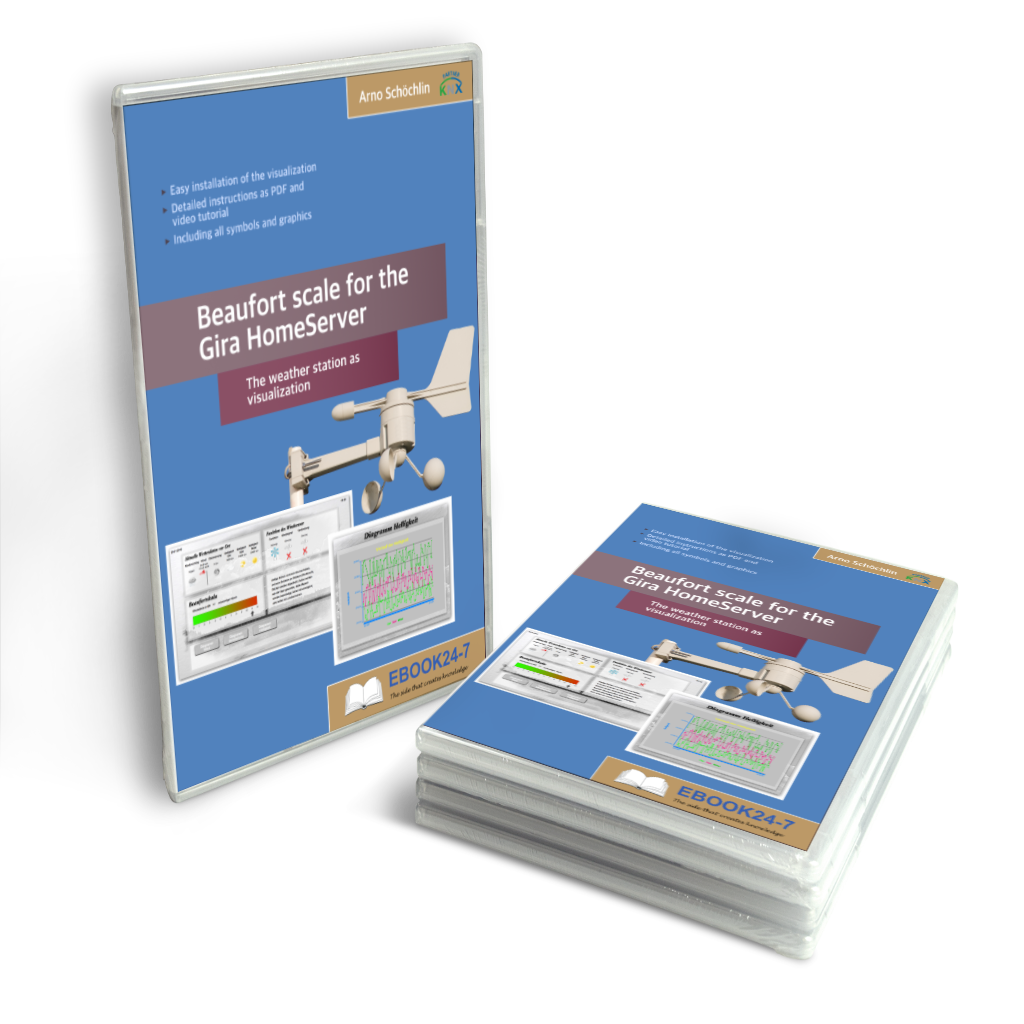
Beaufort scale for Gira Homeserver
46,99€
This finished visualization page for the Gira Homeserver shows you the current weather data from your local weather station in a clear visualization including a Beaufort scale. You can use the designed visual page freely in your projects.
Once purchased, always downloaded!
Only German Version, English Coming soon!
Description
A Beaufort scale combined with the current weather data on site!
The Beaufort scale is a scale that serves to classify wind according to its speed It is the most widely used system for describing wind speed.
- Have you installed a KNX weather station in your project?
- Have you installed a KNX wind sensor or a KNX combined sensor?
Then a visualisation page for weather data should not be missing in any project. It is a nice thing to have in order to display all weather data on site clearly and illustratively prepared on a visualisation page. Also, find out which wind speed prevails with corresponding wind strength on site.
Incidentally and for certain security functions, such as awnings or external blinds, it is important that the user also sees what wind speeds are forthcoming. This can be used to better adapt the security objects of the ETS or the Expert to the project. For this purpose, the user only needs to read and communicate the desired values.
The diagrams tell you the course of brightness and wind speeds. Possible weather forecasts can be determined from this.
You can learn from the instructions:
- how to import the visualisation page into your project
- which communication objects are required
- how to parameterise KNX devices
- how to adapt the Beaufort scale to your project
All presented visualisation pages have been checked and run free of error on several Gira HomeServers from the third to the fourth generation.
Programming the Gira HomeServer is not difficult!
Especially those with finished visualisation pages.
These are constantly being expanded and your suggestions optimise existing and include new ones.
And do not forget — there is no improvement without the valuable feedback of our readers!
The team at ebook24-7.de wishes you lots of success and a lot of fun learning Gira HomeServer.
Note
Note
For all interested buyers, who do not come from Germany, we have good news!
Now all interested buyers can also buy outside of Germany or EU on eBook24-7.
The shop has been adjusted for tax purposes and now corresponds to the EU decision to be observed since 1.1.2015. This means that VAT is payable in the country where the buyer lives. Unfortunately, this adjustment brings with it a price increase of the articles, which results from the consideration of the sales tax
We look forward to your purchase and wish you a nice time.
Content
The following files are included in the collection
- Visualisation page in resolution 1366 × 768 pixels
- Visualisation page in resolution 1024 × 768 pixels
- Export demo group addresses from the ETS
- All graphics used in the visualisation are provided in PNG, JPG and GIF format
- Detailed 57-page instruction as a PDF with over 40 screenshots
- In the live tutorial (about 20 minutes), you will be shown how to insert and adapt the visualisation page into a project
Only logged in customers who have purchased this product may leave a review.


Reviews
There are no reviews yet.